Housing Inflation and Cost Burdens
Joseph Dean
A specter is haunting America—the specter of inflation. The Consumer Price Index (CPI) jumped to 9.1% in June 2022 and currently stands at 3.2% overall as of October 2023. Alongside inflation, there has been a housing boom that has raised home and rental prices, leading to fears that households, particularly renters, are experiencing increased cost burdens. In this blog, we will overview the components of inflation, the differential impact of these component price changes, the cost burden methodology and its relationship to inflation, and the policy options available.
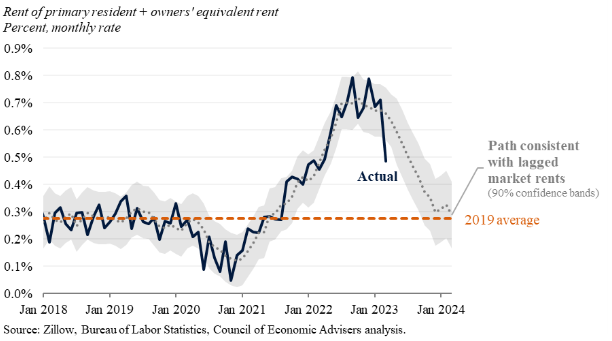
The overall inflation rate has declined overall since its June 2022 peak, but certain components of the CPI remain elevated. Shelter is the single largest component of the CPI at 34.6%. According to the November CPI release for October, housing increased 6.7% year over year. Its contribution to monthly inflation remains historically elevated, while down slightly from its 90% share of the July 2023 increase in inflation. Many, including those at the White House, have used the phrase “housing inflation” to describe the recent inflationary period (see figure).
The standard measure of housing cost unaffordability is known as cost burden. When a household spends more than 30% of its income on housing costs, it is considered cost-burdened. In 2021, nearly one-third of American households were cost-burdened; for renters, this figure was even higher at 49%. Additionally, 24% of renters were severely burdened or paying half of their income on housing costs. This group represented 92% of the 1.2 million increase in the number of cost-burdened renter households overall in 2021.
Despite the widespread use of the 30% threshold, this measure might understate the true level of cost burdens for renters because it does not account for what a household can afford. The standard method does not account for variations in non-housing spending needs such as childcare, healthcare, and food. These needs vary depending on the qualitative differences of the households, such as age, the number of children present, size, and other factors. It treats all incomes the same; thus, the standard measure does not account for how low-income cost-burdened households experience the effects of the rental burdens differently than high-income households.
To account for these shortcomings, the residual income burden (RIB) method has been proposed. Residual income is the amount of income left over after paying for housing. It is what is needed to afford all non-housing expenses at a level to produce a certain standard of living. Additionally, it accounts for the fact that household housing costs are typically fixed whereas other expenditures are negotiable or can be foregone entirely. The major drawback to the RIB method is defining what the benchmark standard of living should be when doing expenditure estimates. For this reason, the RIB method typically complements rather than replaces the standard method. Using both together provides a better measure of cost burden than when each is used separately.
One study used estimates of household expenditures including childcare, healthcare, and taxes mapped onto data from the 2018 1-year American Community Survey (ACS) to measure cost burdens using the RIB method. It found that 62.1% of households faced burdens under the RIB method versus 47.9% with the standard method.
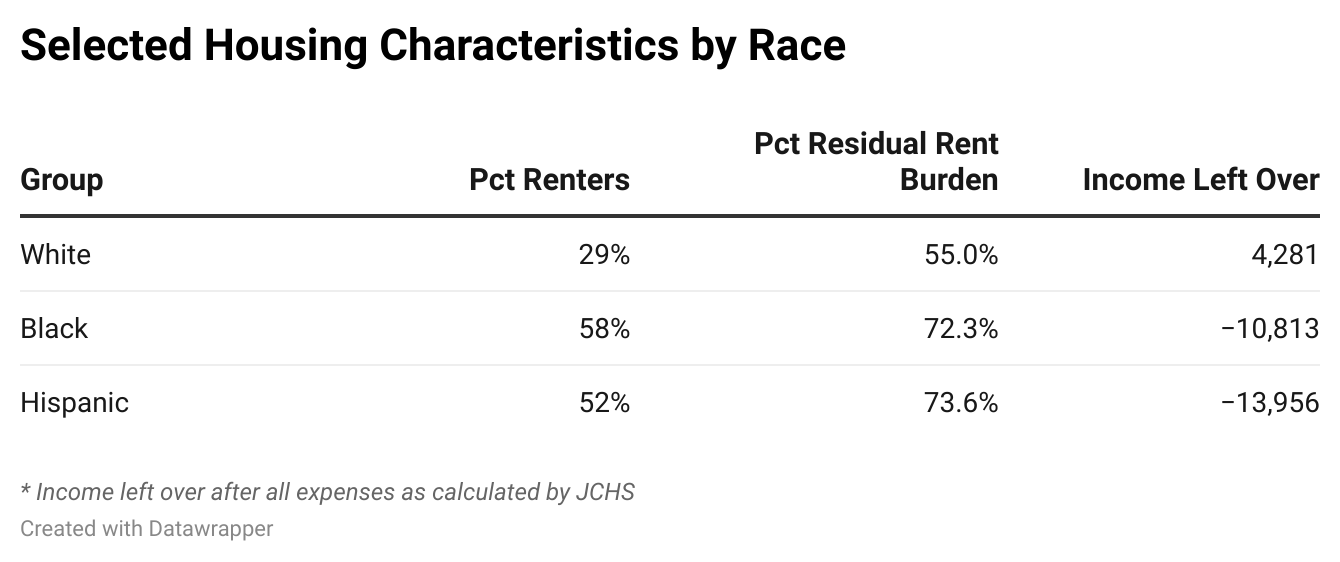
The RIB method showed higher cost burdens relative to the standard method for all income groups. Interestingly, low-income metropolitan areas had higher RIB rates than high-income ones, and middle-income renters had the highest difference between the RIB rate and the standard method rate. The authors suggest that a combination of higher average incomes and lower numbers of low-income households might explain both findings. Additionally, having children present, being a single parent, and a Black or Hispanic household resulted in a higher chance of being residually rent burdened. For Black and Hispanic households, low homeownership rates mean that these groups bear the brunt of residual rent burdens as a whole.
This study is called “Rent Eats First”, a phrase used by one of the households interviewed and speaks to the nature of how rent can affect other expenses. Because rent comes as the most significant and non-negotiable fixed cost for households, other expenses are sometimes foregone to ensure that rent is paid. Unfortunately because of this grim reality, many families and children skip meals or other vital expenses to save money to pay the rent.
Extrapolating from this study, the current housing-led inflation period is affecting households unevenly with the effects being distributed based on their demographic characteristics, income, and location. The study suggested that the RIB method offers several policy possibilities including decreasing the cost of other household expenditures particularly transportation, the second largest expenditure.
The authors note that reducing transportation costs, whether through public transit investments in the long term or household subsidies in the short term, could lower both RIBs and the effects of inflation felt by households. Coincidentally, prices of transportation services increased at 10.3% year over year representing the largest increase of all major expenditures in the CPI. Insurance rates have skyrocketed in recent years alongside the price of used vehicles. For the former, stronger regulation or even price controls on the concentrated car insurance market could stamp out price increases.
Car notes and insurance frequently cannot be substituted for other goods like public transit because either these alternatives do not exist, or the changeover would be too disruptive for working families. This means changes in transportation costs can have a disproportionate impact on low-income households, especially severely rent-burdened ones. Thus, rent eats first, but transportation has an unruly appetite as well.
Housing inflation also affects homeowners. Because high inflation led the Federal Reserve to raise interest rates, the mortgage rate on a typical 30-year fixed mortgage has increased to almost 7.3% versus 2.8% in August 2021. This means that a homebuyer purchasing a home 2 years ago at around the median price of $400,000 with a 15% down payment of $60,000, would have paid $1,397 monthly for a total of $502,000. At 6.8%, the household pays $2,216 monthly or $797,000 over 30 years! The inflation-to-interest rate channel is one way that homeowners are affected by shelter inflation.
The boom in housing and rental costs is reflected in elevated inflation numbers. These increased costs have raised concerns about affordability and housing security for American renters. The traditional measure of cost burden, spending over a third of one’s income on housing, might not accurately reflect the true scale of the housing burden. The residual income method may be more useful in elucidating the differential effects of housing costs on households. The RIB method also reinforces the fact that households experience inflation differently depending on the same characteristics that go into determining differential cost-burden rates.