Racial Disparities in Labor Markets in Colombia and the US
Digna P. Mosquera, MA
The differentials in labor market outcomes among races provide evidence of the systematic exclusion and discrimination to which the Black population is consistently exposed worldwide. This blog uses microdata from the Colombian Household survey and the main conclusions from Wilson and Darity (2022) to show racial labor market disparities in Colombia and the US. It also suggests that Black people can experience labor markets that have very different characteristics but end up suffering the same severe socio-economic disparities.
Literature about labor market racial disparities in Latin America and Colombia, in particular, are limited. In Latin America, inequalities across the labor market are usually included in scholarship about the persistence of poverty among Afro-descendant communities and differential outcomes in terms of education and income (World Bank, 2005; Morrison, 2008; Diaz-Bonilla et al., 2018). For Colombia, the literature has focused primarily on wage differentials, leaving unemployment and informal labor activities out of the discussion (Peña & Wills, 2010; Gonzales-Rivas, 2012; Pederson, 2018).
Racial disparities in the US labor market are a more widely discussed topic based on more availability of data than in other countries. The U.S. Bureau of Labor Statistics (BLS) started reporting disaggregated unemployment data in the 1970s (BLS, 2023). For 2021, the unemployment level for African Americans was 8.6 percent, 3.3 percentage points above the national average (5.3 percent), and 3.9 percentage points above the white unemployment rate. African Americans are the population group in the US with the highest unemployment levels, and this trend has been sustained for decades (BLS, 2023).
In contrast to the share of African Americans (0.13) in the U.S. population, a quarter of Latin America’s population self-identifies as Afrodescendant. Although this community is settled all over the continent, 98% of the population is concentrated in Brazil, Colombia, Cuba, Mexico, and Venezuela (Inter-American Development Bank, 2022). These countries experience inequality and exclusion against Black people as much as the United States. In the last 15 years, Latin America has experienced remarkable economic growth and a reduction in its poverty levels. However, such improvements have not been evenly distributed among its population. Poverty levels for Afrodescendants are three times higher than their mestizo counterparts in Brazil and Uruguay and over ten percentage points higher in Colombia, Ecuador, and Peru. Afroperuvians and Afrouruguayans experienced an annually decreasing poverty rate between 7 and 10 percent, while non-Afrodescendants’ poverty rate in the same countries declined between 9 and 14.5 percent. In rural contexts, the probability of an Afrodescendant household being poor increases as much as 38 percent in Peru, 16 percent in Brazil, and 13 percent in Colombia.
Racial Gaps and Unemployment
The Black-white unemployment gap in the U.S. has historically remained at or slightly above a ratio of 2:1 since the 1970s. Conventionally, long-run market disparities are usually attributed to human capital and geographical differences, since workers’ information and skills determine the labor supply and the wage patterns, and they promote economic growth (McClelland, 2012). As Carruthers and Wanamaker (2017) concluded, human capital played a significant role in the 1940s wage and the occupational status gap among races in the South. In support of that proposition, Cairó and Cajner (2018) demonstrated that more-educated workers usually experience lower and less volatile unemployment rates than less-educated workers due to the on-the-job complementary training afforded by their employers. However, the question remains. Do these theories successfully explain the experience of Black workers in the labor market?
Wilson and Darity (2022) showed how the racial gaps had been sustained for more than 40 years in the United States. Characteristics such as educational attainment, graduation rates, and age still do not explain race differences in unemployment rates. Actually, the unemployment ratio remains almost unchanged over time when controlling for educational attainment (see Figure 1). The most notable difference is the level of unemployment for those with some college and those with advanced degrees. As the authors argue, this is one of the strongest pieces of evidence against conventional theories that attempt to explain racial gaps as a lack of investment in human capital. These findings are consistent with Cajner et al. (2017), who additionally found that the Hispanic-white unemployment ratio, on the contrary, is primarily explained by lower educational attainment among the non-US-born Hispanic population.
Figure 1. Black-white unemployment rate ratios by educational attainment in the US
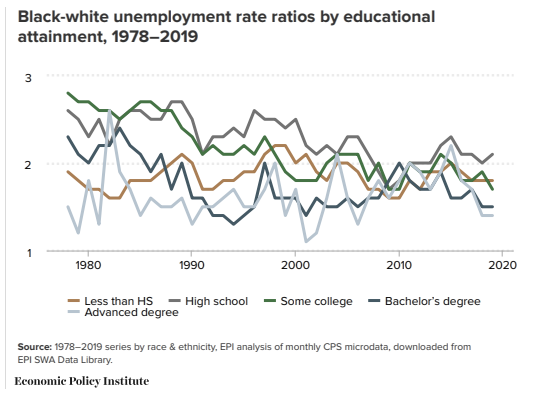
Source: Wilson and Darity (2020)
Unsurprisingly, the Colombian labor market shows similar patterns to the U.S. labor market in terms of racial differences, and still, education attainment and geographical differences fail to explain the gap. Over the last decade, unemployment rates in Colombia have remained between 10 and 12 percent. Disaggregating these rates by race and gender indicates that Afrocolombian females (AF) have the highest levels of unemployment among the rest of the demographic groups even when their level of education reaches the University level. In addition, AF who have University degrees experience higher levels of unemployment than the rest of the groups with less education. Similarly, although Afrocolombian males experience lower unemployment than their female counterparts, they still maintain a prominent disparity with respect to non-Afro-Colombian males up to technological education levels. Even though Afro-descendant unemployment is significantly lower at the graduate level, this may be a product of their underrepresentation at the highest levels of education (See Figure 2 and Table 1).
Figure 2. Unemployment levels by education attainment in Colombia
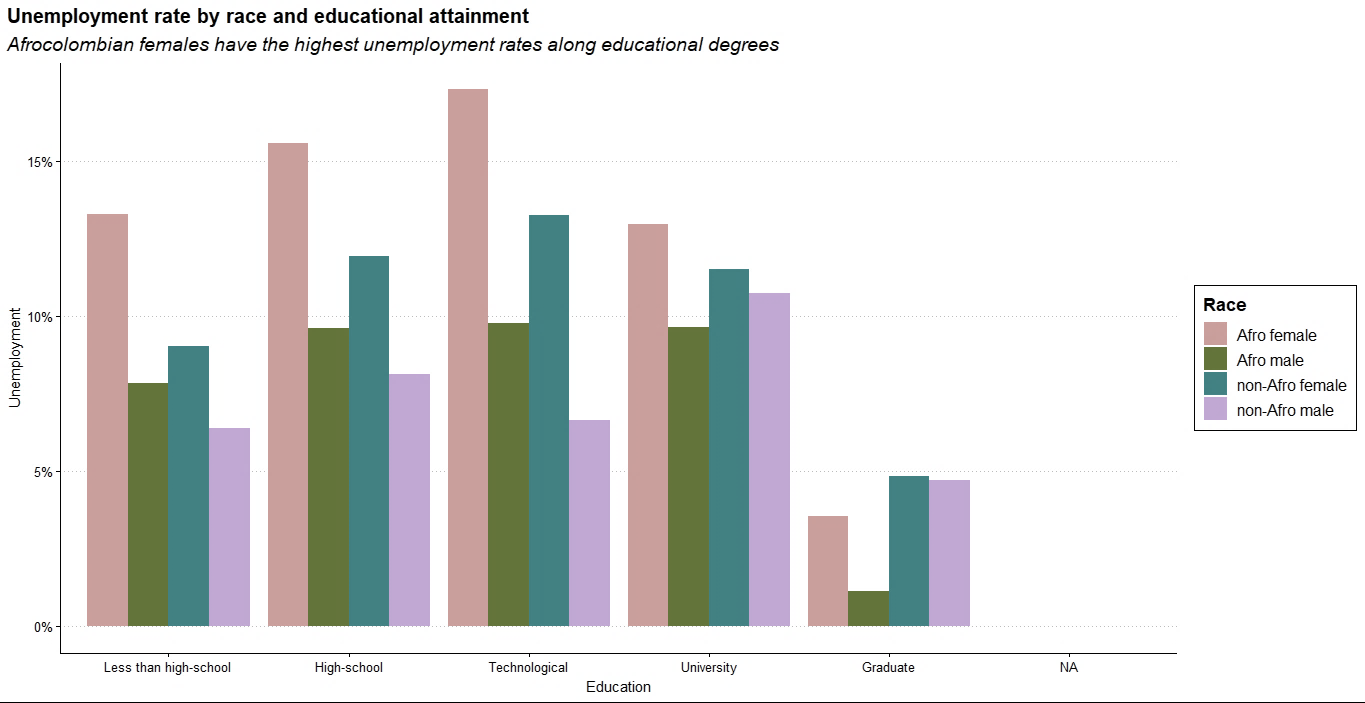
Source: Authors' based on National Administrative Department of Statistics.
Racial gaps still persist when including geographic differences based on Colombia's natural regions. The Andean region consists of the main cities in the country. It is the nucleus of economic development and the center of migration of Black and Indigenous communities. The main reasons for the migration of Afro-Colombian youths are job opportunities search, education, and family affairs (DANE, 2005). However, the primary underlying cause for the exodus is violence, forced displacement, and land dispossession exerted by the country's armed groups (Niño, 1999). Colombia has the second-largest internal displacement figures in the world – after Syria – that disproportionally affects peasants, Indigenous peoples, and Black communities. Approximately 85 percent of displaced people come from rural areas mainly inhabited by these populations (National Center of Historical Memory (CNMH), 2015). And the social, economic, and security conditions of the victims in the arrival cities are precarious. The UNHCR estimates that 98.3% of Afrocolombians victims of the conflict live below the poverty line (UNHCR, 2012).
On the other hand, the Pacific and Caribbean regions have the highest proportions of Afrodescendants, as well as the highest poverty levels in the country (DANE, 2020). AF generally maintains the highest unemployment levels by education and region (see Figure 3). In the Andean region, where Afrodescendant communities are a minority, they face higher levels of unemployment at the lowest levels of education. Even in the Pacific region, the unequal relationship is maintained up to the university level. This situation appears to be different from the United States experience, where unemployment levels in majority-Black cities such as Washington, DC, present larger gaps between Blacks and whites.
Figure 3. Unemployment levels by race, educational attainment, and region in Colombia
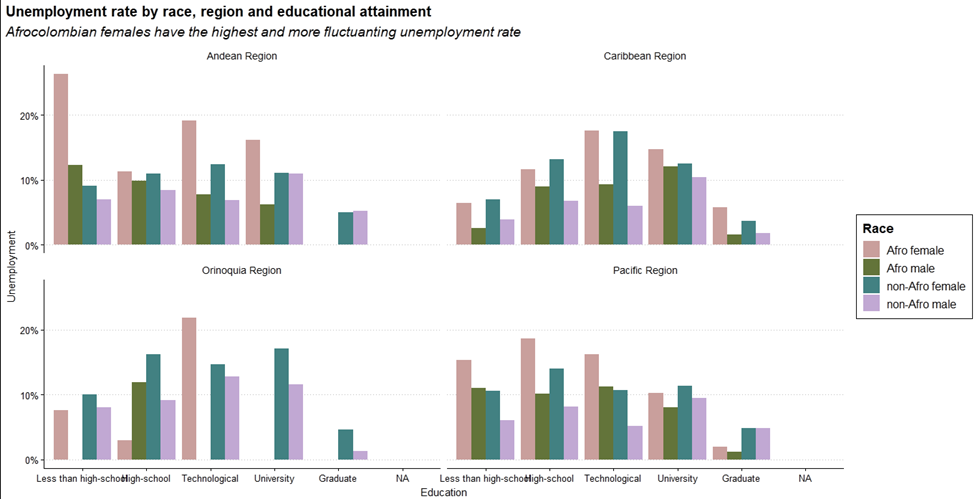
Source: Authors' based on National Administrative Department of Statistics.
Different Labor Markets, Similar Racially Disparate Outcomes
The particular character of the Colombian labor market differs from that of the U.S. As educational attainment increases, unemployment levels increase as well. All demographic groups with university degrees, except AF, experience higher levels of unemployment than their relative peers with no education or with a high-school diploma (see Figure 1). This phenomenon is the opposite of the U.S. labor market, where education seems to pay off with higher employment opportunities (BLS, 2021). Unemployment decreases at higher educational levels in the US (see Figure 5). However, regardless of the distinctive behavior of each labor market, unequal relations between Black workers and their counterparts are a common denominator in both countries.
Figure 4. Unemployment rates by educational attainment in Colombia and the US in 2021.
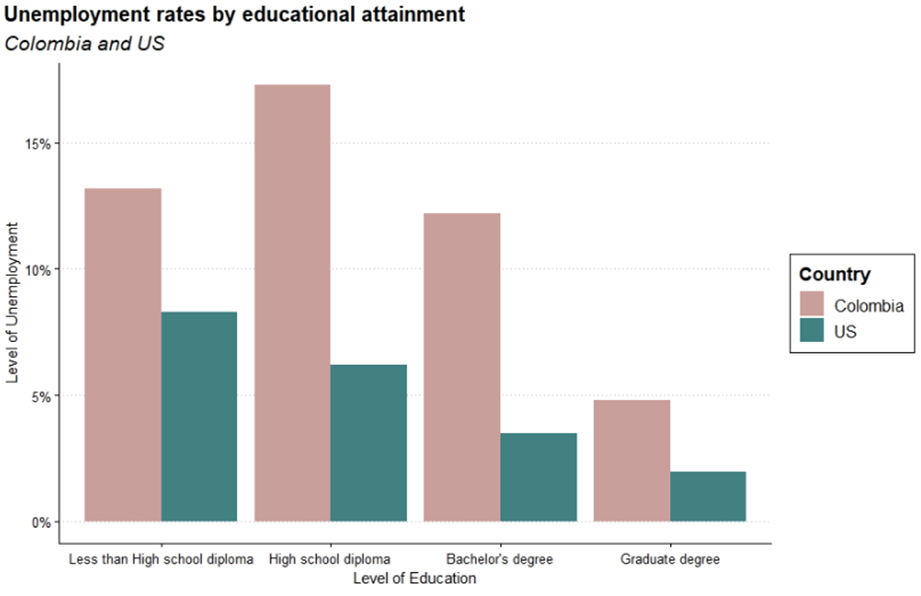
Source: Authors' based on National Administrative Department of Statistics and BLS (2021)
Race differentials and the informal market
Informality is a serious concern in the Colombian labor market and differs markedly from the U.S. Almost 60 percent of the country's workforce participates in the labor market as informal workers (DANE, 2022). The definition of informality has been much debated in different research studies, but a straightforward definition is all economic activities outside tax and regulatory policies (Smith & Wandner, 2011). However, in the specific case of Latin America, informality also means vulnerability and poverty (ECLAC).
A probability model of the informal sector considers a range of independent factors as possible causes of informality:
P(Informal│Xi ) = β_0 + β_1 Age + β_2 Female + β_3 Afro + β_4 Female*Afro + β_5 Highschool + β_9 Technological + β_7 University + β_8 Region + β_9 Single + β_10 Fulltime + β_11 Employment + Ɛ_i
This model measures the likelihood of belonging to the informal sector depending on different demographics, educational levels, region, and type of employment if any. It includes race and gender, with non-Afrocolombians and males as the baseline. If race and gender are determining factors of informality, it means that these populations are likely to remain in poverty, even when gaining access to work. According to the results provided in Table 1, educational attainment explains more than 85% of the informality level in the country, while race shows a modest reduction in the probability of informality. The negative sign of the race coefficient may suggest that the probability is captured in other variables within the model.
Table 1. Regression results from the Informality model
|
|
|||
|
|
|
|
|
|
|
|
|
|
|
|
|
|
|
|
|
|
|
|
|
|
|
|
|
|
|
|
|
|
|
|
|
|
|
|
|
|
|
|
|
|
|
|
|
|
|
|
|
|
|
|
|
|
|
|
|
|
|
|
|
|
|
|
|
|
|
|
|
|
|
|
|
|
|
|
|
|
|
|
|
|
|
|
|
|
|
|
|
|
|
|
|
|
|
|
|
|||
|
|
|||
|
|
|||
|
|
|||
|
|
|||
These findings suggest that education is the entry barrier to more secure and stable working conditions. The systematic violation of Afrocolombians' constitutional right to access education puts this population at significant social and economic risk. As Table 2 shows (see the Appendix), the Afrocolombian population is overrepresented at the lowest educational levels and underrepresented at the highest. Three cities from the Andean region alone – Bogotá D.C, Medellín, and Santander – host more than 50 percent of total higher education students nationwide, and these are the cities with the lowest share of Afrocolombians (Ministerio de Educación, 2016). In addition, the immediate transition rate of students from high school to University had a national average of 42.4 percent in 2017. Meanwhile, the transition rate of Afrocolombian students in the same year was 26.9 percent, 15.5 percentage points below the national average (Ibarguen et al., 2019). These disproportions, like those in the U.S., generate disparate outcomes, unequal bargaining power, and, ultimately, a segregated labor market (Wilson & Darity, 2022).
Despite informal activities being a global phenomenon, more developed economies may report smaller figures than developing countries. In 2018, the World Bank reported an informality level in the US at 8.1 percent; however, these figures are widely debated since a considerable proportion of people engage in informal activities as a non-primary income option. Similarly, informal workers may be reluctant to report such jobs, leading to an undercount (Smith & Wandner, 2011).
Even though the levels of labor informality are different in the two countries, both experience racial inequality. As William & Darity (2022) note, the US labor market is occupationally segregated by the overrepresentation of Black workers in low-wage jobs and underrepresentation in higher-wage occupations. While African Americans represent 11.6 percent of the workforce in the United States, they represent more than 25 percent of the population working as food servers, taxi and shuttle drivers, barbers, and hotel workers (Solomon et al., 2019).
Racism is a crucial phenomenon when understanding the evolution of institutions in the modern world. The U.S. and Colombian labor markets are marked by differences in their structure, organization, and institutionalization. Neither labor market structure works to eliminate the inequality experienced by Black people in either context. For this reason, eliminating racial disparities requires long-term and intensive intervention, targeted policy initiatives, and more legal protections for the Black workforce worldwide.
Appendix
Table 2. General Characteristics of the sample by race
|
|
||||
|
|
|
|
|
|
|
|
|
|
|
|
|
|
|
|
|
|
|
|
|
|
|
|
|
|
|
|
|
|
|
|
|
|
|
|
|
|
|
|
|
|
|
|
|
|
|
|
|
|
|
|
|
|
|
|
|
|
|
|
|
|
|
|
|
|
|
|
|
|
|
|
|
|
|
|
|
|
|
|
|
|
|
|
|
|
|
|
|
|
|
|
|
|
|
|
|
|
|
|
|
|
|
|
|
|
|
|
Source: Authors' based on the National Administrative Department of Statistics.
References
ACNUR. (2012). Situación Colombia: Afrodescendientes. Hoja Informativa junio de 2012. ACNUR. https://www.acnur.org/fileadmin/Documentos/RefugiadosAmericas/Colombia/2013/SituacionColombia_Afrodescendientes_junio2012.pdf?view=1
BLS. (2021). Education pays, 2020. Bureau of Labor Statistics. Retrieved March 28, 2023, from https://www.bls.gov/careeroutlook/2021/data-on-display/education-pays.htm
Cairó I., Cajner, T., (2018). Human Capital and Unemployment Dynamics: Why More Educated Workers Enjoy Greater Employment Stability, The Economic Journal, Volume 128, Issue 609, Pages 652–682, https://doi.org/10.1111/ecoj.12441
Cajner, T., Radler, T., Ratner D., and Vidangos I., (2017). Racial Gaps in Labor Market Outcomes in the Last Four Decades and over the Business Cycle, Finance and Economics Discussion Series 2017-071. Washington: Board of Governors of the Federal Reserve System, https://doi.org/10.17016/FEDS.2017.071.
Carruthers, C., & Wanamaker, M., (2017). Separate and Unequal in the Labor Market: Human Capital and the Jim Crow Wage Gap, Journal of Labor Economics, University of Chicago Press, vol. 35(3), pages 655-696.
CNMH. (2015). Una nación desplazada: Informe nacional del desplazamiento forzado en Colombia. Bogotá. https://www.centrodememoriahistorica.gov.co/descargas/informes2015/nacion-desplazada/una-nacion-desplazada.pdf
DANE. (2005). CENSO 2005 Jóvenes afro-colombianos: Caracterización Socio-demográfica y Aspectos de la Migración Interna. DANE. Retrieved March 28, 2023, from https://www.dane.gov.co/files/censo2005/etnia/sys/jovenes_afrocolombianos.pdf
DANE. (2020, December 21). Pobreza monetaria departamental en Colombia 2019. DANE. Retrieved March 28, 2023, from https://www.dane.gov.co/files/investigaciones/condiciones_vida/pobreza/2019/Comunicado-pobreza-monetaria-dptos_2019.pdf
DANE. (2022). Indicadores de mercado laboral.
Freire, G., Diaz-Bonilla, C., Schwartz Orellana, S., Soler Lopez, J., & Carbonari, F. (2018). Afrodescendants in Latin America Toward a framework of inclusion. Obtenido de https://openknowledge.worldbank.org/handle/10986/30201
Inter-American Development Bank. (2022). How to foster the inclusion of Afro-descendant people in the cities of Latin America and the Caribbean?
Ibarguen, A. S., Muñoz, J. V., Gonzales, S., Moreno, A., Arrechea, M., Alomia, L. S., Biojó, J. C., & Granja, A. F. (2019). El pueblo negro y la educación superior: Una aproximación a la situación de acceso, permanencia, pertinencia y graduanción. Una Apuesta a la Democratización Étnico Racial de la Educación Pública. Proceso de Comunidades Negras.
McClelland, R. (2012). A Review of Recent Research on Labor Supply Elasticities. Congressional Budget Office, 42. https://wayback.archive-it.org/org-593/20210212044425/https://www.cbo.gov/sites/default/files/112th-congress-2011-2012/workingpaper/10-25-2012-recentresearchonlaborsupplyelasticities.pdf
Ministerio de Educación. (2016). Tasas de cobertura y concentración de la Educación Superior en Colombia. Ministerio de Educación Nacional. Retrieved March 28, 2023, from https://www.mineducacion.gov.co/1759/articles-359643_recurso_1.pdf
Morrison, J. (2008). Race and Poverty in Latin America: Addressing Development Needs of African Descendants. Obtenido de https://www.un.org/en/chronicle/article/race-and-poverty-latin-america-addressing-development-needs-african-descendants
Niño, J. F. (1999). Las migraciones forzadas de población, por la violencia, en Colombia: una historia de éxodos, miedo, terror, y pobreza. Revista Electrónica de Geografía y Ciencias Sociales. https://www.ub.edu/geocrit/sn-45-33.htm
Pederson, D. (2018). One God, One Race, One Tongue: A Study of Racial Inequality of Colombia. Obtenido de https://openworks.wooster.edu/independentstudy/7980/
Peña, X., & Wills, D. (2010). Ethnic Earnings Gap in Colombia. Obtenido de https://www.banrep.gov.co/sites/default/files/eventos/archivos/Ethnic_0.pdf
Smith, D., & Wandner, S. A. (2011). Informal and Nonstandard Employment in the United States. THE URBAN INSTITUTE. https://webarchive.urban.org/UploadedPDF/412372-informal-nonstandard-employment-in-us.pdf
Solomon, D., Maxwell, C., & Castro, A. (2019, August 7). Systematic Inequality and Economic Opportunity. Center for American Progress. Retrieved March 28, 2023, from https://www.americanprogress.org/article/systematic-inequality-economic-opportunity/
US Bureau of Labor Statistics. (2023, January). Labor force characteristics by race and ethnicity, 2021 : BLS Reports: U.S. Bureau of Labor Statistics. Retrieved March 28, 2023, from https://www.bls.gov/opub/reports/race-and-ethnicity/2021/home.htm
Wilson, V., & Darity, W. (2021). A Fair Shake for Black Workers. Democracy Journal of Ideas.
World Bank. (2005). The Gap Matters: Poverty and Well-Being of Afro-Colombians and Indigenous Peoples. Obtenido de https://documents1.worldbank.org/curated/en/337791468242365622/pdf/330140CO.pdf