The Dissimilarity Index as a Tool for Accountability in Ending Racial Segregation
Racial segregation in housing has a long history in the United States. Many economic and legal structures have historically prevented African Americans in particular from acquiring decent livable housing, and have forced the Black community into substandard dwellings at exorbitant housing costs. Formal legal policies such as FHA sponsored redlining1, covenants, exclusion from the GI bill, and real estate steering all contributed to and reinforced the segregation of the Black community into substandard environments. Supreme Court decisions such as Shelley v. Kraemer (1948) and Jones v. Mayer Co. (1968) outlawed the exclusion of African Americans from most communities, but race-based housing patterns were still in force by the late 1960s. The Civil Rights Act of 1964 (Title VII) and the Fair Housing Act of 1968 were passed in response to the Civil Rights Movements and urban rebellions that sought to change this situation. But did they lead to change?
While people report anecdotally that housing segregation persists, social scientists recommend answering such basic questions using data and statistical tools. Drawing from human ecology models of urban racial patterns2, the Index of Dissimilarity (DI) remains today a useful approach to measuring segregation3. This index attempts to capture population concentrations that deviate from what, in principle, should be an even areal distribution of households with no spatial differentiation by race. To the extent that the index suggests high levels of racial separation, racial disparities are likely to be present. The index itself does not directly show such economic and social disparities, but is a signal that such “dissimilarities” could be associated with limited access to and acquisition of resources.
The Index of Dissimilarity (DI)
This index measures the evenness with which two mutually exclusive groups are distributed across the geographic units that make up a larger geographic entity. This index has often been used to examine the distribution of Blacks and Whites across the census tracts that make up a metropolis. Its minimum value is zero, or no dissimilarity, and its maximum value is 1 (or 100%), or complete separation of each race from the other. Here is the basic technique. A tutorial will show how to use this procedure step-by-step.
Assume:
bi = the Black population of the ith areal unit, e.g. census tract
B = the total Black population of the large geographic entity for which the index of dissimilarity is being calculated.
wi = the White population of the ith area unit, e. g. a census tract
W = the total White population of the large geographic entity for which the index of dissimilarity is being calculated
Then the index of dissimilarity measuring the segregation of Blacks from Whites is
(1/2) Σ |bi /B – wi /W|
The summation is over the component areal units such as census tracts. The value of this index is statistically independent of the relative size of the groups used in its computation. It can be expressed as a 0 to 1 (share) or a 0 to 100 (percentage) number
Trends in Housing Segregation Today in Major Jurisdictions
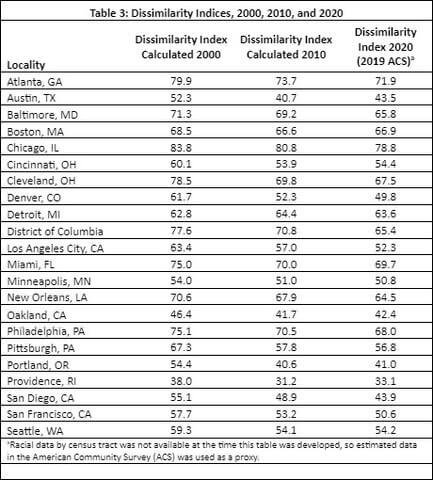
Using census data, it is straightforward to compute DIs and examine their trends over time (see the tutorial blog). The U.S. Census acknowledges the importance of DIs in its discussion of housing patterns4. The key data needed for such calculations are the population by race in each census tract5 in the jurisdiction of interest (e.g., a city, county, or other unit). Calculating the DIs for several major cities over three census years yields Table 3.
Limitations of the Dissimilarity Index
There are numerous limitations to the index, many of which have been debated since the 1940s6. Still, it is a useful starting point for understanding the extent of racial segregation. Other indices are also possible, summarized most aptly by the Census itself7. A growing challenge to the use of the DI is the extent to which housing patterns reflect wider racial diversity than the traditional Black-White combination. The rapidly growing Latinx and Asian populations in particular have rendered a sole focus on Black-White segregation misleading8. Similarly, the rise in the use of biracial/multiracial categories can complicate this calculation. Still, as the central historical form of segregation, sanctioned and enforced both legally and extra-legally, Black-White segregation remains the centerpiece of any study of racial segregation in the U.S.9
Uses of the Dissimilarity Index
The DI can be used cross-sectionally to compare segregation between otherwise comparable communities. It can also be used to track changes over time in the segregation in a particular community. It could be included with care in cross-sectional regression analysis as an independent variable indicating the role of residential segregation in affecting a dependent variable of interest.
In the U.S., DIs for the selected cities in Table 3 show that racial segregation is substantial and that none of the cities is close to complete integration. It also indicates that, over the 2000-2020 period, racial segregation has eased slightly. Chicago’s DI of 83.8 in 2000 (the highest DI in the table) fell over the next two decades to 78.8. It remains a highly segregated city by race.
Conclusion
As we approach the 60th anniversary of the Civil Rights Act, much remains to be done to end racial residential segregation in the United States. Studying the measurements of such segregation and using them in advocacy work will help hold accountable the policy-makers responsible for assuring fair housing for all.
Endnotes
1For a brief account of the FHA’s Roosevelt-era discriminatory policy, see https://www.history.com/news/housing-segregation-new-deal-program
2Angelina Grigoryeva and Martin Ruef. 2015. The historical demography of racial segregation. American Sociological Review 80, No. 4 (August), 814-842.
3See, for example, Karl E. Taeuber and Alma F. Taeuber. 1965. Negroes in Cities: Residential Segregation and Neighborhood Change. Chicago: Aldine; and Julius A. Jahn, Calvin F. Schmid and Clarence Schrag, 1947. The measurement of ecological segregation. American Sociological Review 12:293-303.
4https://www.census.gov/topics/housing/housing-patterns.html
5Census block-groups could also be used.
6Rebecca Allen, Simon Burgess, Russell Davidson, and Frank Windmeijer. 2015. More reliable inference for the dissimilarity index of segregation. Econometrics Journal 18, 40–66. doi: 10.1111/ectj.12039
7John Iceland, Daniel H. Weinberg, and Erika Steinmetz, U.S. Census Bureau, Series CENSR-3, Racial and Ethnic Residential Segregation in the United States: 1980-2000, U.S. Government Printing Office, Washington, DC, 2002. See also https://www.census.gov/topics/housing/housing-patterns/guidance/appendix-b.html
8See, for example, Pamela Bennett and Andrew Cherlin. 2011. The neighborhood contexts in which low-income families navigate welfare reform: Evidence from the Three-City Study. Social Science Quarterly 92, No. 3, 735-760.
9Douglas Massey and Nancy Denton. 1998. American Apartheid: Segregation and the Making of the Underclass. Cambridge: Harvard University Press.