The Dissimilarity Index: A Tutorial
Rodney D. Green, Ph.D.
This blog shows how to calculate the index of dissimilarity and provides examples about its possible uses in indicating levels of residential racial segregation
The Index of Dissimilarity (DI)
As noted in the earlier blog, the DI measures the evenness with which two mutually exclusive groups (often racial groups) are distributed across the geographic units that make up a larger geographic entity. Its minimum value is zero, or no dissimilarity, and its maximum value is 1 (or 100%), or complete separation of each race from the other. Here is how to measure it.
Assume:
bi = the Black population of the ith areal unit, e.g. census tract
B = the total Black population of the large geographic entity for which the index of dissimilarity is being calculated.
wi = the White population of the ith area unit, e. g. a census tract
W = the total White population of the large geographic entity for which the index of dissimilarity is being calculated
Then the index of dissimilarity measuring the segregation of Blacks from Whites is
(1/2) Σ |bi /B – wi /W|
The summation is over the component areal units such as census tracts. The value of this index is statistically independent of the relative size of the groups used in its computation. It can be expressed as a 0 to 1 (share) or a 0 to 100 (percentage) number.
An Example
Consider the following hypothetical city with five census tracts and the number of Black and White households in each tract (Figure 1). A cursory glance would show that Blacks are the majority in tracts 1 and 2 and Whites in tracts 3, 4, and 5. How would this distribution appear in a dissimilarity index?
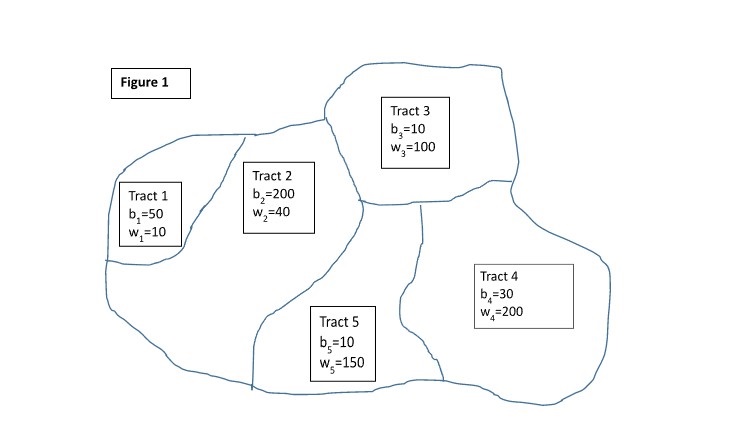
Hypothetical City
Using the formula above for the DI, we make the following calculations:
B = Σibi = 50+200+10+30+10 = 300
W = Σiwi = 10+40+100+200+150 = 500
bi /B = 50/300 = .1667
wi /W = 10/500 = .0200
|b1 /B – w1 /W| = .1467, for example
We construct Table 1 and calculate the DI.
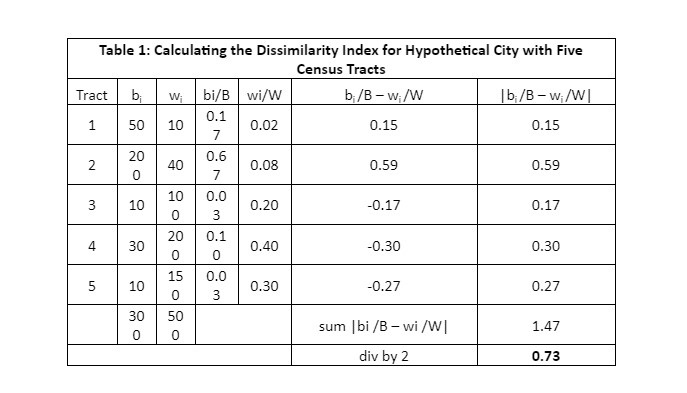
The share 0.73 (or 73%) is quite high on the DI range of 0 to 1 (0 to 100), reflecting a high level of racial separation of the races and requiring that 73% of Blacks must move to achieve full integration.
The 100% Racially Integrated City
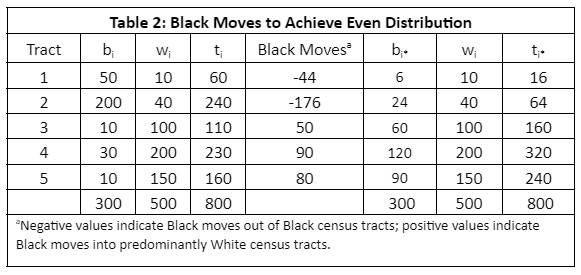
In this example, 73% of Blacks must move In order for Blacks to be evenly distributed across the five census tracts; 300/800 or 37.5% of the population in each tract would then be Black, matching the Black city-wide share of total city population. We assume the White population remains constant in each tract. The total population in each tract would therefore change as a result of these moves.
In this example, 73% of Blacks must move In order for Blacks to be evenly distributed across the five census tracts; 300/800 or 37.5% of the population in each tract would then be Black, matching the Black city-wide share of total city population. We assume the White population remains constant in each tract. The total population in each tract would therefore change as a result of these moves.
In this example, Blacks would have to move from tracts 1 and 2 to tracts 3, 4, and 5 to achieve an even distribution across the city. If 44 Blacks from census tract 1 and 176 Blacks from census tract 2 move, these tracts will meet the 0.375 Black share requirement. The total number of Blacks needed to be relocated from tracts 1 and 2 to tracts 3, 4 and 5 is 44 + 176 =220, or 73% of the city’s Black population, as indicated by the DI. Consider the following algebraic calculation to determine the final location of Blacks by census tract.
1. State the share of the population that is Black
B/(B+W) =0.375
2. Multiply both sides by (B+W)
B = 0.375(B +W)
3. Expand the terms in the parentheses
B = 0.375B + 0.375W
4. Subtract .375B from both sides, switch sides, and simplify B
0.375W = B – 0.375B
0.375W = 0.625B
5. Divide both sides by .625 and switch sides
B = (0.375/0.625)W = 0.6W
The Black population in each tract will therefore equal 60% of the white population in each tract, shown in the Table 2.
The hypothetical city would now be changed as shown in the figure below.
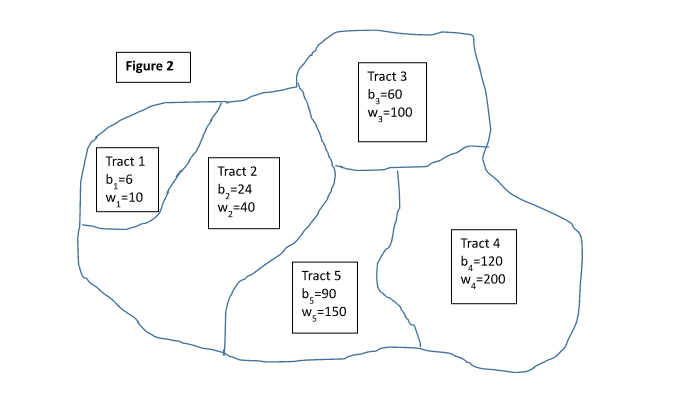
One outcome of such a set of moves is higher (lower) densities in previously disproportionately White (Black) census tracts. This hypothetical outcome is reminiscent of the impact of Title VII of the Civil Rights Acts, when White neighborhoods became available to Black households that previously had been constrained, by law and extra-legal practices, to live in densely populated inner cities. The DI is a static measure that does not account for the dynamic “White flight” response in many communities once restrictions on Blacks were eased. High levels of segregation, as measured by the DI, continue in many U.S. cities (see Table 3 in earlier blog).
Black – White Swaps to Achieve 100% Integration
Another approach to remedying racial segregation measured by the DI would be to imagine that Black and White households would swap housing units with each other until full integration were achieved. This process would maintain the same total population in each census tract. In this case, both Black and White households would move whereas in the earlier case, only Black households moved.
Again, the Black population accounts for 300/800 or 37.5% of the population in the hypothetical city and the White population for 500/800 or 62.5%. How might the new census tracts look? How many Black and White households will have to move in order to achieve evenness of distribution? In this case, we assume that total population in each tract remains constant (no change in population densities by tract) with Blacks and Whites essentially swapping locations to bring about 100% racial integration.
In this table, we repeat the original populations of Blacks and Whites and include the total population in each tract. We note that the share of Blacks in the population for the hypothetical city is 0.375 (300/800) and Whites 0.625 (500/800). To achieve full integration in this case, Blacks must account for 37.5% of each census tract’s population and Whites 62.5%. To achieve this distribution, we multiply the total population in each tract (which remains constant) by these percentages to determine the new numbers of Blacks and Whites in each tract (rounded off to a whole person). So, for example, in tract 1 which is originally predominantly Black, 28 Black people must move out and 28 White people move in; the new White population would be 38, the Black population 23. For tract 3, which was predominantly White initially, 31 Black people would move in and 31 White people move out (see Table 3)
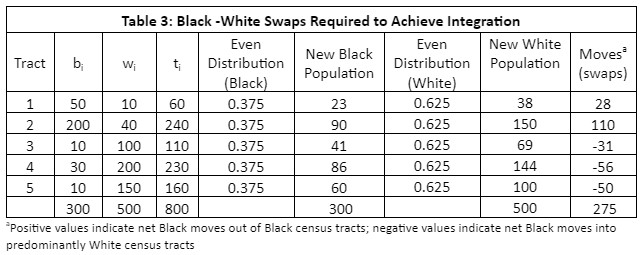
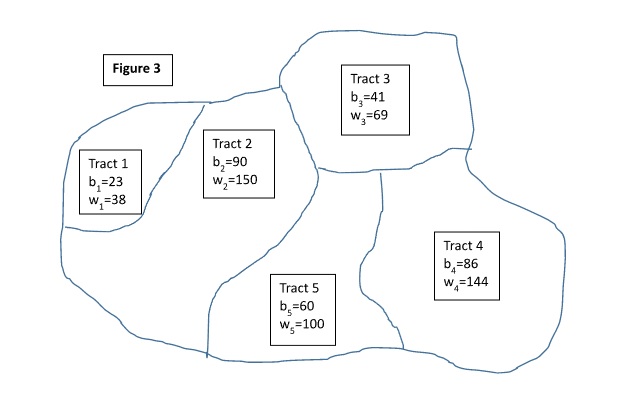
The city’s population remains 800 with a Black population of 300 and a White population of 500 with the same density of population in each tract, but the city is 100% integrated (see Figure 3).
Computing DIs for Metropolitan Areas from Census Data
Using census data, it is straightforward to compute DIs and examine their trends over time. The U.S. Census acknowledges the importance of DIs in its discussion of housing patterns. The key data needed for such calculations are the population by race in each census tract in the jurisdiction of interest (e.g., a city, county, or other areal unit). We calculated the DIs for several major cities over three census years yields Table 3 presented in the earlier blog.
Securing Census Data to Calculate Metropolitan Area DIs
The steps in securing the appropriate census data to compute DIs follow.
Go to https://data.census.gov, then
- Select “Advanced Search” from options below search box
- From the “Find a Filter” menu on left:
- Select “Geography”
- From “Most Commonly Used Geographies”, select “Tract”
- Select desired state
- Select county where city jurisdiction is located (e.g. “Alameda” for Oakland, CA)
- Select “Geography”
- Back on “Find a Filter” menu, select “Surveys”
- Select “Decennial Census”
- Select “Redistricting Data” PL94-171 (only option)
- Back on “Find a Filter” menu, select “Topics”
- Select “Race and Ethnicity”
- Check the “Race and Ethnicity” box
- Select “Race and Ethnicity”
- Click on “Search” button that appears on the lower right of screen
- Choose P1 table (ignore the “view all 2 products”)
You will now have a table of racial composition by tract number that you can download as an Excel file. To print in a usable form, select “transpose” from the icons above table. That will give you tracts in the rows and population numbers by race in columns. There are numerous racial categories in Table P1. For a simple Black/White Dissimilarity index, select D003 and D004 for the computation.
An example of computing the DI for Washington DC using this approach is contained in the appendix.